Introduction
The graphical method provides a visual approach to solving a pair of linear equations in two variables. By plotting each equation on a graph, we can determine the nature of their solutions based on the behavior of the lines representing these equations. This method helps us visually interpret whether the equations have a unique solution, infinitely many solutions, or no solution.
Types of Solutions
- Unique Solution: If the lines intersect at a single point, the pair of equations is consistent and has exactly one solution. This means there is a unique set of values for
and
that satisfies both equations simultaneously.
- No Solution: If the lines are parallel, they do not intersect. This implies that the equations are inconsistent and have no common solution.
- Infinitely Many Solutions: If the lines coincide (overlap completely), the pair of equations has infinitely many solutions. In this case, the equations are dependent and consistent, meaning they represent the same line and thus share every point on that line as a solution.
Algebraic Interpretation Using Ratios
For a pair of linear equations:
The behavior of the lines and the type of solutions can be determined by comparing the ratios of the coefficients:
- Intersecting Lines: If
, the lines intersect at a single point, providing a unique solution.
- Coincident Lines: If
, the lines are coincident, meaning they overlap completely and have infinitely many solutions.
- Parallel Lines: If
, the lines are parallel, so there is no solution as they do not intersect.
Example Problem
Let's examine three different pairs of equations to understand how their graphical representations provide solutions:
Pair 1
and
- Here, the lines intersect, so we have a unique solution.
Pair 2
and
- The lines coincide, indicating infinitely many solutions.
Pair 3
and
- The lines are parallel, meaning there is no solution.
Observations from Graphical Representations
From these examples, we conclude that for any pair of linear equations and
- If
, the equations represent intersecting lines with a unique solution.
- If
, the equations represent coincident lines with infinitely many solutions.
- If
, the equations represent parallel lines with no solution.
Graphical Verification Example
Example 1
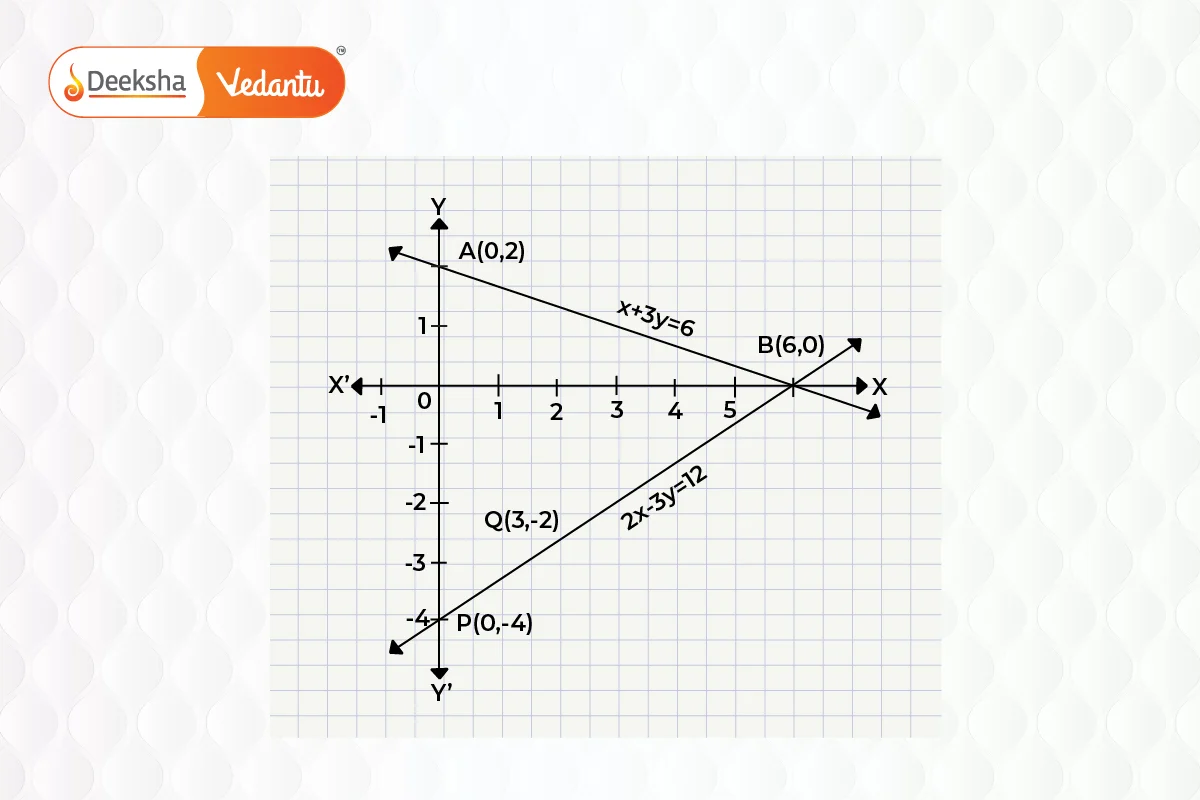
Check graphically whether the pair of equations is consistent and, if so, solve them graphically:
and
Solution: To solve graphically:
- Find two solutions for each equation to plot points.
- For
:
- For
:
Plot these points on a graph and join them to form lines. The intersection point represents the solution to the system.

FAQs
The graphical method can be imprecise when finding exact values, especially if the point of intersection is not on grid lines. It also becomes less practical when dealing with more complex systems or when precise solutions are required.
Yes, by comparing the ratios of the coefficients ,
, and
, we can determine the type of solution:
- If
, the lines intersect and there is a unique solution.
- If
, the lines are coincident and there are infinitely many solutions.
- If
, the lines are parallel and there is no solution.
If the equations have different slopes, it means the lines will intersect at a single point. Therefore, the system of equations will have a unique solution.
Infinitely many solutions occur when the two lines overlap completely, or in other words, they are coincident. This means every point on the line satisfies both equations, so there are infinitely many solutions.
A unique solution exists when the lines represented by the equations intersect at exactly one point. This means there is one specific pair of values for and
that satisfies both equations.
If two lines are parallel, it means that they will never intersect, indicating that there is no common solution to the equations. In this case, the equations are said to be an “inconsistent pair” and have no solution.
In the graphical method, the point of intersection represents the solution to the pair of equations. The coordinates of the intersection point satisfy both equations simultaneously.
The graphical method involves plotting each equation on a graph as a line and finding the point(s) of intersection. The coordinates of the intersection point represent the solution to the equations. If the lines intersect at a single point, there is a unique solution. If they are parallel, there is no solution, and if they coincide, there are infinitely many solutions.


 , the lines intersect at a single point, providing a unique solution.
 , the lines are coincident, meaning they overlap completely and have infinitely many solutions.
 , the lines are parallel, so there is no solution as they do not intersect.


Get Social