Introduction to Correlation Coefficient
The correlation coefficient is a crucial statistical metric that quantifies the relationship between two variables, indicating the strength and direction of this relationship. It is pivotal in fields like statistics, economics, and social sciences to determine how closely two variables move in relation to one another.
Definition of Correlation Coefficient
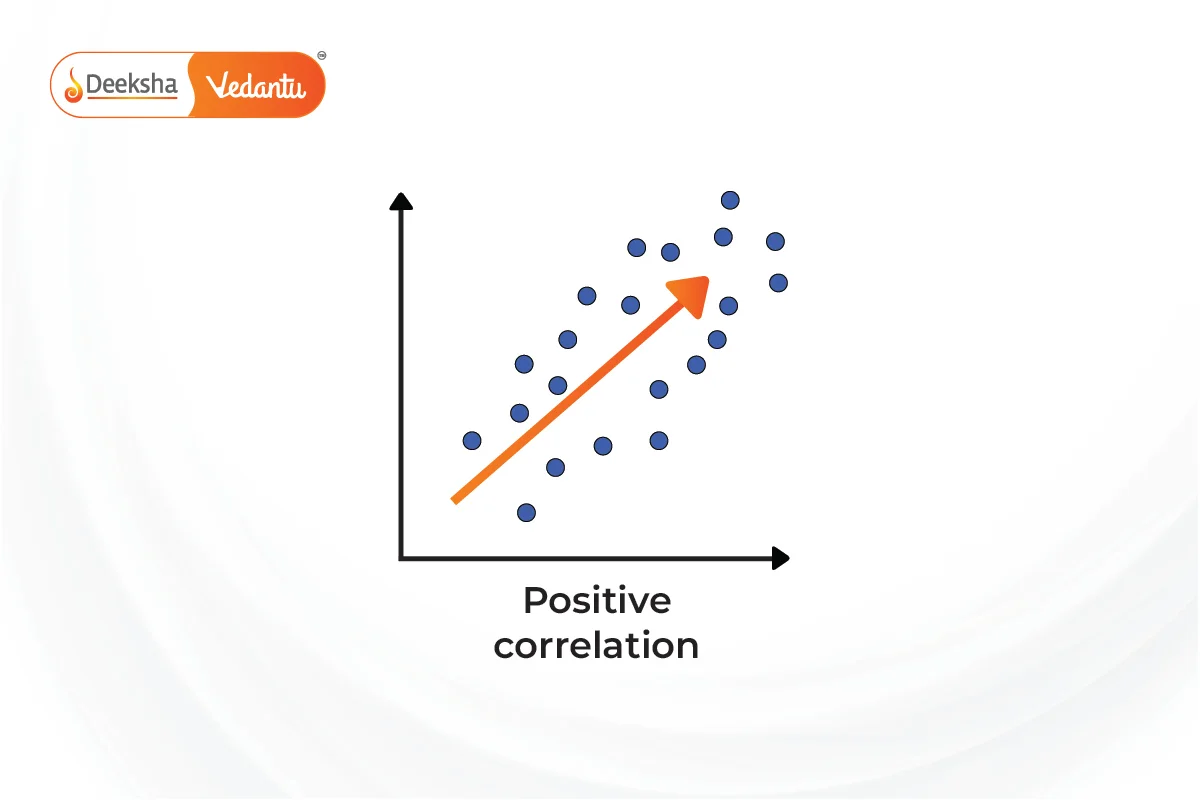
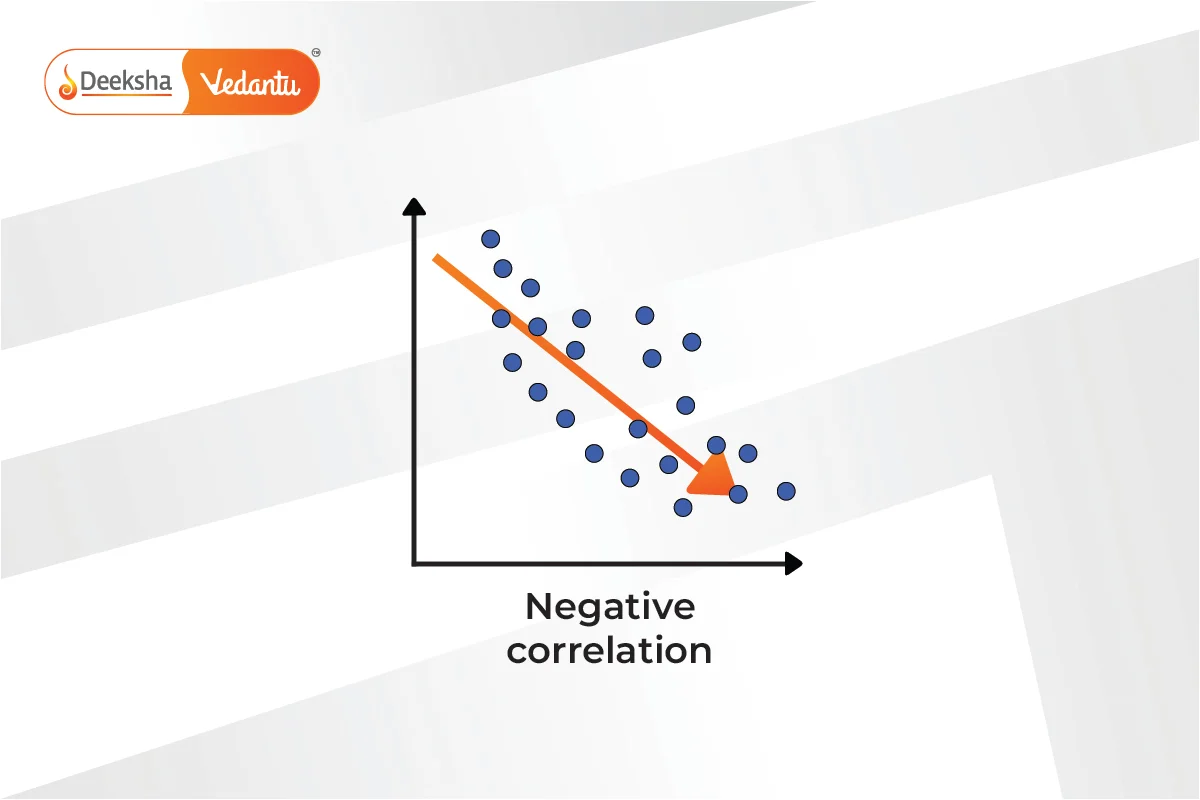
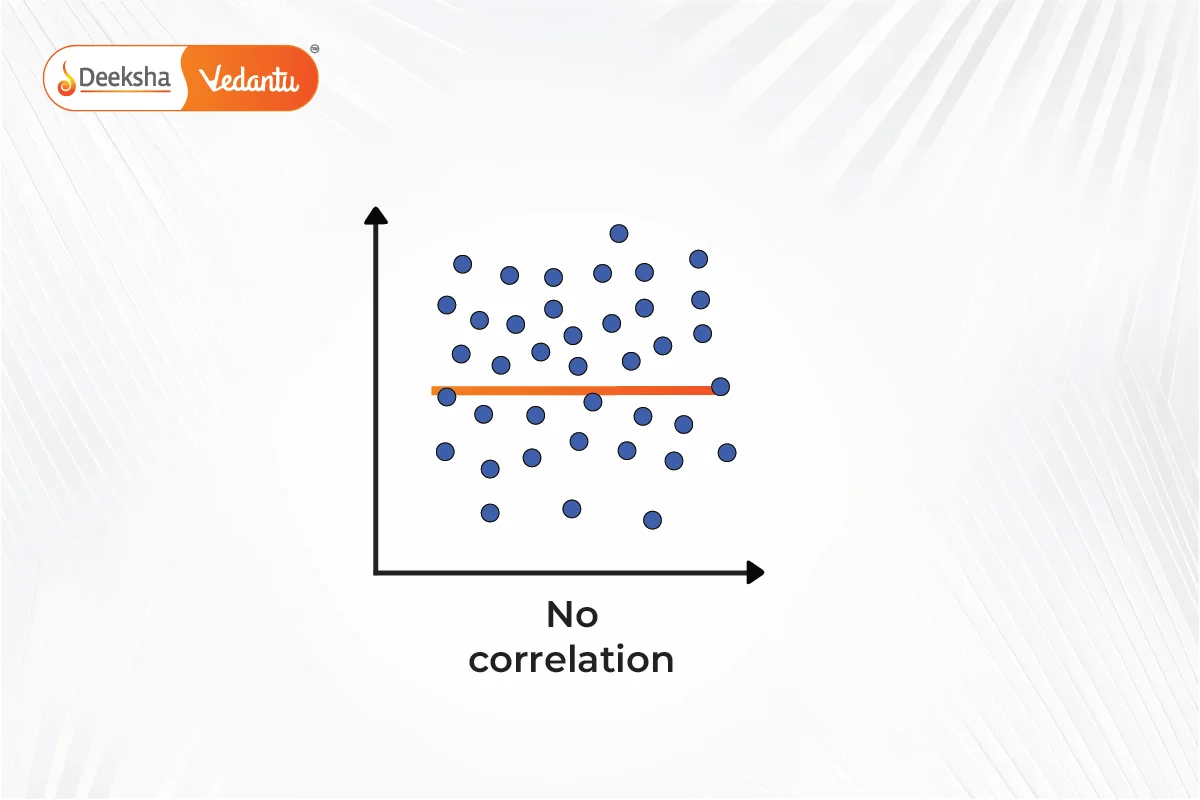
The correlation coefficient measures the degree to which two variables are related. It is a value that lies between -1 and +1, where +1 signifies a perfect positive relationship, -1 signifies a perfect negative relationship, and 0 indicates no relationship at all.
Mathematical Representation
The Pearson correlation coefficient, often denoted by (rho), is calculated as:
Here, represents the covariance between variables
and
, while
and
are the standard deviations of
and
, respectively.
Key Assumptions
For Pearson’s correlation coefficient to provide reliable results, certain assumptions must be met:
- Normal Distribution: Both variables should be normally distributed.
- Linearity: The relationship between the variables should be linear.
- Homoscedasticity: The scatterplot of the variables should show consistent variability across all values.
- No Outliers: Outliers can distort the correlation, leading to misleading interpretations.
Calculating the Correlation Coefficient
To calculate the Pearson correlation coefficient, you can use the following formula:
is the number of pairs of scores
is the sum of the products of paired scores
and
are the sums of the x scores and y scores, respectively
and
are the sums of the squares of the x scores and y scores, respectively
Types of Correlation
- Positive Correlation: Both variables increase or decrease together.
- Negative Correlation: One variable increases as the other decreases.
- Zero Correlation: No discernible pattern is observed between the variables.
Visualizing Data
A scatterplot is commonly used to visualize the relationship between the two variables and to identify the presence of any outliers or patterns that might indicate a non-linear relationship.
Properties of the Correlation Coefficient
- The correlation coefficient is unitless and not affected by changes in the scale of measurement.
- It is symmetric, meaning the correlation between
and
is the same as the correlation between
and
.
What is Cramer’s V Correlation?
Cramer’s V correlation is a statistical measure similar to the Pearson correlation coefficient but specifically designed for categorical data in contingency tables larger than . It assesses the strength of association between two nominal variables and provides a value between 0 and 1, where 0 indicates no association and 1 indicates a perfect association.
Interpretation of Cramer’s V Values
- 0.25 or higher: Indicates a very strong relationship between the variables.
- 0.15 to 0.25: Suggests a strong relationship.
- 0.11 to 0.15: Denotes a moderate relationship.
- 0.06 to 0.10: Implies a weak relationship.
- 0.01 to 0.05: Reflects no or negligible relationship.
Other Significant Types of Correlation Coefficients
1. Concordance Correlation Coefficient
This coefficient measures how well pairs of observations fall on a line and conform to the “gold standard” measurements. It is crucial in studies requiring agreement or consistency among repeated measures.
2. Intraclass Correlation
Used primarily in reliability studies, the intraclass correlation assesses the consistency or repeatability of measurements performed by different observers measuring the same phenomenon.
3. Kendall’s Tau
A non-parametric correlation measure used to determine relationships between columns of ranked data, Kendall’s Tau is useful when the data does not meet the requirements of parametric tests due to outliers or non-normality.
4. Moran’s I
Used in spatial analysis, Moran’s I measures spatial autocorrelation, providing insights into the patterned clustering or dispersion across a geographic area.
5. Partial Correlation
This measures the degree of association between two variables while controlling for the effects of one or more additional variables. It’s essential in studies where multiple interrelated factors influence the outcomes.
6. Phi Coefficient
This is a measure used for the association between two binary variables. It’s similar in interpretation to the Pearson correlation coefficient but tailored for dichotomous data.
7. Point Biserial Correlation
A special case of Pearson’s correlation, this method assesses the relationship between a continuous variable and a binary variable. It’s often used in studies involving a dichotomous categorical variable and a continuous variable.
8. Spearman Rank Correlation
As the nonparametric version of Pearson’s correlation coefficient, Spearman’s rank is used when the assumptions for Pearson are not met, typically in data that is not normally distributed or is ordinal.
9. Zero-Order Correlation
This term refers to correlations that are calculated without controlling for any other variables, providing a direct correlation measure between two variables without adjustments.
Conclusion
Understanding the correlation coefficient and its proper calculation is essential for accurately interpreting the relationship between variables in statistical analyses. By adhering to the assumptions and correctly applying the formula, researchers can glean significant insights into the data they are studying, aiding in better decision-making and predictions.
FAQs
Outliers can skew the results of the correlation coefficient, making the relationship appear stronger or weaker than it actually is.
A zero correlation indicates that there is no linear relationship between the variables.
No, the correlation coefficient can indicate the strength and direction of a relationship between two variables but it cannot establish causality.
A correlation coefficient of +0.8 suggests a strong positive relationship between the variables, meaning as one variable increases, the other tends to increase as well.


![Rendered by QuickLaTeX.com \displaystyle \boldsymbol{r = \frac{n(\sum xy) - (\sum x)(\sum y)}{\sqrt{[n \sum x^2 - (\sum x)^2][n \sum y^2 - (\sum y)^2]}}}](https://deekshalearning.com/wp-content/ql-cache/quicklatex.com-cb157867dfaaec5c47f166d3ee2a6c6c_l3.png)





Get Social