
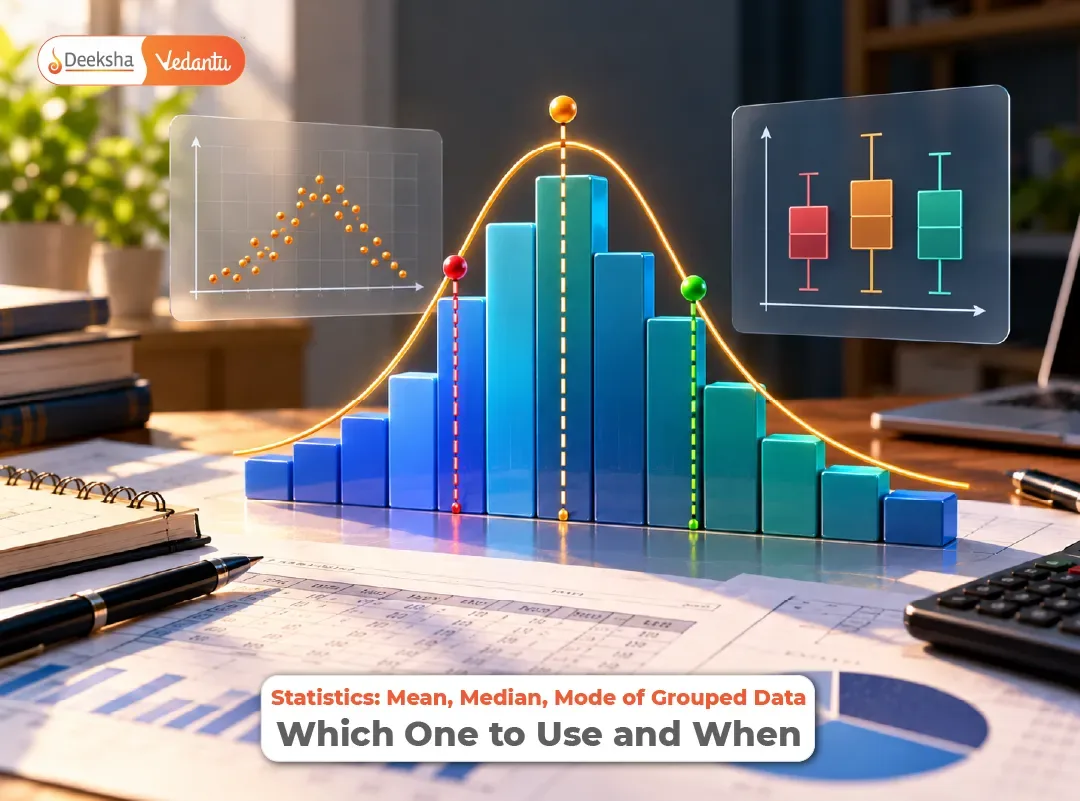


A class of fifty students, a table of marks in ranges, and three questions: find the mean, the median and the mode. Most students can recall all three formulas. Fewer can say why there are three, and fewer still can say which one a real situation calls for. That second skill is what this article is about, along with the slips that quietly ruin otherwise correct working.
The three measures are not three ways of computing the same thing. They answer three different questions about a set of numbers: what is the average amount, what is the middle value, and what is the most common value. Once you see them as three questions, choosing between them stops being guesswork. If you want the formulas laid out alongside theory, keep the pages on mean of grouped data, median of grouped data and mode of grouped data open as you read.
Three Questions, Three Measures
The mean answers: if the total were shared out equally, what would each get? It uses every value, so it moves when any value moves. The median answers: what value splits the data into two equal halves? It depends on position, not on how large the extreme values are. The mode answers: which value, or class, occurs most often? It depends on frequency alone.
That difference in what each one uses explains almost every choice:
- Use the mean when the data are fairly balanced, with no extreme values, and when you want a figure that reflects every observation. Average marks of a class and average daily rainfall are typical.
- Use the median when a few very large or very small values would pull the mean away from what is typical. Incomes, house prices and waiting times are the usual cases.
- Use the mode when you want the most common or most popular item. A shop deciding which shoe size to stock most of is not asking about an average; it is asking about the mode.
A small example makes this concrete. Five monthly incomes, in thousands of rupees, are 20, 22, 24, 25 and 300. The mean is 391 divided by 5, which is 78.2. The median is 24. Nobody in that group earns anything close to 78.2; the mean has been dragged up by one value. The median describes the typical person far better. Asking which measure to use is really asking what the data are going to be used for.
Setting Up Grouped Data Before Any Formula
Grouped data is a table of class intervals with frequencies. A few preparations decide whether everything after them is right.
Class marks. The class mark is the midpoint of a class: (lower limit + upper limit) divided by 2. For the class 20 to 30, it is 25. In the mean formulas, every observation in a class is assumed to sit at its class mark.
Continuous classes. The formulas for median and mode assume the classes are continuous, with no gaps. If the table is written as 1 to 5, 6 to 10, 11 to 15, there is a gap of 1 between the upper limit of one class and the lower limit of the next. Subtract half the gap from each lower limit and add half to each upper limit, giving 0.5 to 5.5, 5.5 to 10.5 and 10.5 to 15.5. Skipping this step is one of the most common causes of a wrong median or mode.
Class size. The class size h is the width of a class, and the formulas assume it is the same for all classes. If it is not, the question will usually be written so that only some classes matter.
The introduction to statistics page covers the vocabulary of frequency tables if any of these terms feel unfamiliar.
Finding the Mean: Three Routes to One Answer
The direct method uses mean = sum of f x divided by sum of f, where x is the class mark. The assumed mean method picks a class mark a and works with deviations d = x minus a, giving mean = a + sum of f d divided by sum of f. The step deviation method goes one step further: if all deviations are multiples of the class size h, divide by h to get u = (x minus a) / h, and then mean = a + h x (sum of f u divided by sum of f).
All three give the same answer. The shorter routes exist only to keep the arithmetic small when class marks are large. The key rule is to divide by the sum of frequencies, never by the number of classes.
Finding the Median: Which Class, Then Where in It
Compute n, the total frequency, then n over 2. Build the cumulative frequency column. The median class is the first class whose cumulative frequency is at least n over 2. Then:
Median = l + ((n/2 minus cf) / f) x h
where l is the lower limit of the median class, cf is the cumulative frequency of the class before the median class, f is the frequency of the median class and h is the class size.
The formula is a way of saying: you are part of the way through the median class, and the fraction of the way is the number of observations you still need divided by the number in the class.
Finding the Mode: Pick the Modal Class, Then Adjust
The modal class is the class with the highest frequency. Then:
Mode = l + ((f1 minus f0) / (2 f1 minus f0 minus f2)) x h
where f1 is the frequency of the modal class, f0 is the frequency of the class just before it and f2 is the frequency of the class just after it. The mode is pulled towards whichever neighbour is larger, which is exactly what the formula does.
The chapter notes for CBSE Class 10 Statistics collect all three formulas in one place, which is useful for revision.
One Data Set, All Three Measures, Every Step Checked
Marks of 50 students:
| Class | 0 to 10 | 10 to 20 | 20 to 30 | 30 to 40 | 40 to 50 |
| Frequency | 5 | 8 | 15 | 16 | 6 |
Mean (direct method). Class marks are 5, 15, 25, 35 and 45. Then f x values are 25, 120, 375, 560 and 270, which sum to 1350. Mean = 1350 / 50 = 27.
Mean (step deviation check). Take a = 25 and h = 10, so u values are minus 2, minus 1, 0, 1 and 2. Then f u values are minus 10, minus 8, 0, 16 and 12, which sum to 10. Mean = 25 + 10 x (10 / 50) = 27. Both methods agree.
Median. n = 50, so n over 2 = 25. Cumulative frequencies are 5, 13, 28, 44 and 50. The first cumulative frequency at least 25 is 28, so the median class is 20 to 30. Here l = 20, cf = 13, f = 15 and h = 10. Median = 20 + ((25 minus 13) / 15) x 10 = 20 + 8 = 28.
Mode. The highest frequency is 16, so the modal class is 30 to 40. Here f1 = 16, f0 = 15 and f2 = 6. Mode = 30 + ((16 minus 15) / (32 minus 15 minus 6)) x 10 = 30 + 10/11, which is about 30.91.
A useful check is the empirical relation: mode = 3 x median minus 2 x mean. Here 3 x 28 minus 2 x 27 = 84 minus 54 = 30, which is close to 30.91. The relation is approximate, not exact, but a big mismatch signals an arithmetic slip somewhere.
The result also tells a story. The mean (27) is below the median (28), which is below the mode (about 31). The marks bunch towards the upper end with a tail towards the low end, and the three measures show that skew between them.
Slips That Quietly Cost Marks
Dividing by the number of classes. The mean divides by total frequency. With five classes and total frequency 50, dividing by 5 gives an answer ten times too large.
Using the wrong cf. In the median formula, cf is the cumulative frequency of the class before the median class, not that of the median class itself. Using the median class’s own cumulative frequency (28 in the example above) would produce a negative fraction.
Forgetting to make classes continuous. Take the table 1 to 5, 6 to 10, 11 to 15 with frequencies 3, 7 and 5. After adjusting, the classes are 0.5 to 5.5, 5.5 to 10.5 and 10.5 to 15.5, and n = 15, so n over 2 = 7.5. Cumulative frequencies are 3, 10 and 15, so the median class is 5.5 to 10.5. Median = 5.5 + ((7.5 minus 3) / 7) x 5 = 5.5 + 3.21, about 8.71. Without the adjustment, a student using l = 6 gets 6 + (4.5 / 7) x 5, about 9.21, which is off by half a unit.
Mixing up f0 and f2 in the mode formula. f0 is the class before the modal class and f2 the class after it. Swapping them changes the answer. Write the three frequencies down in order before substituting.
Forgetting h at the end of the step-deviation formula. The correct form multiplies the fraction by h. Leaving it out gives an answer that is far too small.
Choosing the median class from the frequency column. The median class is chosen using cumulative frequency, not the highest frequency. The highest frequency picks the modal class.
For more practice in checking these, the important questions for Class 10 Maths Chapter 14 and the Statistics MCQs are good ones to try after this article.
Missing Frequencies: A Common Board Twist
A frequent board question gives the mean and asks for a missing frequency. Suppose the classes 10 to 20, 20 to 30, 30 to 40 and 40 to 50 have frequencies 4, x, 6 and 2, and the mean is 28. The class marks are 15, 25, 35 and 45.
Sum of f = 12 + x. Sum of f x = 60 + 25x + 210 + 90 = 360 + 25x. Setting the mean: (360 + 25x) / (12 + x) = 28, so 360 + 25x = 336 + 28x, giving 24 = 3x, so x = 8.
Check: with x = 8, sum of f is 20 and sum of f x is 560, and 560 / 20 = 28. The same set-up works for a missing frequency when the median or the total is given.
What Your Board Expects
Statistics is Chapter 14 in the CBSE Class 10 Maths numbering used on the pages linked here. The three measures of central tendency for grouped data are the core of the chapter. The Karnataka SSLC textbook covers the same measures but numbers the chapter differently. Boards can differ on whether the cumulative frequency graph (ogive) is examined, on whether the step-deviation method is required, and on how bimodal data is handled, so confirm each point against your own board’s current syllabus and sample papers.
If you want a wider view of how data and chance fit together, the blog on probability and statistics is a gentle read.
Frequently Asked Questions
Q1. How do I decide between mean, median and mode?
Use the mean for balanced data without extreme values, the median when a few extreme values would distort the mean, and the mode when you want the most common value. The choice depends on the question being asked about the data.
Q2. How do I find the median class?
Compute n over 2, build the cumulative frequency column, and pick the first class whose cumulative frequency is at least n over 2.
Q3. What is the relation between mean, median and mode?
For moderately skewed data, mode is approximately 3 x median minus 2 x mean. It is an empirical relation, useful as a quick check rather than an exact law.
Q4. Why must classes be continuous for median and mode?
Because the formulas treat each class as a block of the number line with no gaps. If there are gaps, adjust each limit by half the gap before using the formulas.
Q5. Why does the mean use sum of frequencies as the divisor?
Because the sum of frequencies is the total number of observations. Dividing by the number of classes would ignore how many observations fall in each class.
Conclusion: Pick the Measure That Answers Your Question
Mean, median and mode are three answers to three different questions. Decide the question first, prepare the table with class marks and continuous classes, apply the formula carefully, and check with the empirical relation.







Get Social