Introduction
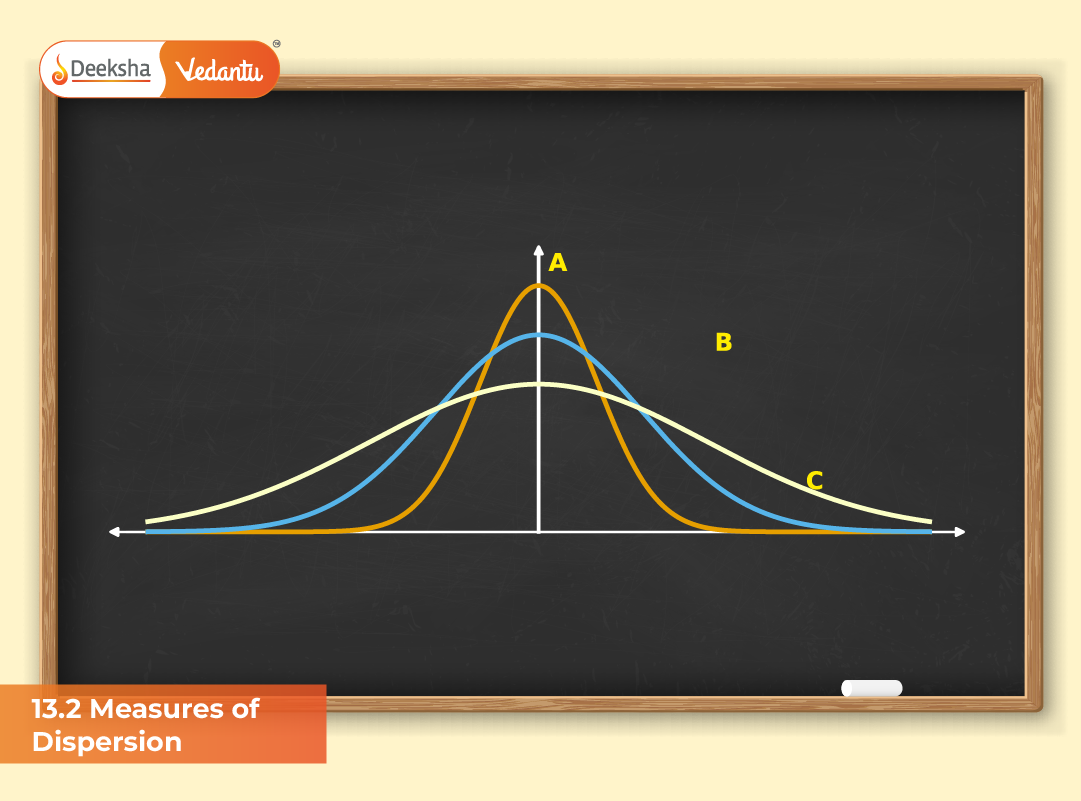
Measures of dispersion are statistical tools that describe how data values are spread or scattered around a central value such as the mean or median. While measures of central tendency provide a single representative figure for the data, dispersion explains how consistent or varied that data is. It quantifies the degree of variability within a dataset — smaller dispersion implies consistency, while larger dispersion signifies high variability.
In this section, we explore three main types of dispersion relevant for JEE preparation — Range, Mean Deviation, and Standard Deviation. Quartile deviation is briefly mentioned but not detailed in this syllabus.
Range
Definition
The simplest measure of dispersion range is the difference between the highest and lowest values in a dataset.
Formula
R = L – S
Where:
R = Range
L = Largest value
S = Smallest value
Coefficient of Range
Coefficient of Range = (L – S) / (L + S)
Merits
- Easy to calculate and interpret.
- Useful for a quick idea of variability.
Demerits
- Considers only extreme values.
- Not suitable for datasets with outliers.
Example
For data 5, 10, 15, 20, 25:
R = 25 – 5 = 20
Range gives a preliminary idea of data spread but lacks depth for complex datasets.
Mean Deviation
Definition
Mean Deviation (M.D.) measures the average of the absolute deviations of each data point from a central measure — mean, median, or mode. It provides a clearer picture of variability than range because it includes all data points.
Formula
For ungrouped data:
M.D. = Σ|x – x̄| / N
For frequency distribution:
M.D. = Σf|x – A| / Σf
Where:
f = Frequency
x = Observed value
A = Mean, Median, or Mode
Merits
- Takes all observations into account.
- Simple and effective for smaller datasets.
Demerits
- Ignores algebraic signs.
- Difficult to handle in algebraic operations.
Example
For data 3, 6, 9:
Mean = 6
M.D. = (|3-6| + |6-6| + |9-6|) / 3 = 2
Average deviation from the mean is 2 units.
Standard Deviation
Definition
Standard Deviation (S.D.) is the most reliable and widely used measure of dispersion. It evaluates how much data values deviate from the mean, providing a precise estimate of variation.
Formula
For ungrouped data:
σ = √(Σ(x – x̄)² / N)
For grouped data:
σ = √(Σf(x – x̄)² / Σf)
Assumed Mean Method
σ = √(Σf d² / Σf – (Σf d / Σf)²)
where d = x – A
Step-Deviation Method
σ = i × √(Σf u² / Σf – (Σf u / Σf)²)
where u = (x – A) / i and i = class interval.
Merits
- Consider all data points.
- Suitable for higher-level analysis like Probability and Correlation.
- Preferred in JEE-level questions.
Demerits
- More computation required.
- Affected by outliers.
Example
For data 2, 4, 6, 8, 10:
Mean (x̄) = 6
σ = √((2-6)² + (4-6)² + (6-6)² + (8-6)² + (10-6)²) / 5 = 2.83
Interpretation
A smaller σ indicates high consistency; σ = 0 implies no variation.
Comparison and Interpretation
| Measure | Definition | Advantages | Disadvantages |
| Range | Difference between largest and smallest value | Simplest to compute | Ignores most data points |
| Mean Deviation | Average of absolute deviations | Considers all data points | Ignores algebraic signs |
| Standard Deviation | Root mean square deviation from mean | Highly accurate | Complex to calculate |
JEE-Based Problems
Q1: Find the standard deviation of data 10, 20, 30, 40, 50.
Mean = 30
σ = √((10-30)² + (20-30)² + (30-30)² + (40-30)² + (50-30)²) / 5 = 14.14
Q2: The mean of 5 observations is 10 and their mean deviation is 4. Find the sum of absolute deviations.
M.D. = Σ|x – x̄| / 5 = 4 ⇒ Σ|x – x̄| = 20
Q3: The range of a dataset is 40 and the largest value is 75. Find the smallest value.
R = L – S ⇒ 40 = 75 – S ⇒ S = 35
Q4: If σ = 0, what does it imply about the data?
All values are identical.
FAQs
Q1. What is the most accurate measure of dispersion?
Standard deviation is considered the most accurate measure as it includes all data points and provides a true sense of variation.
Q2. Why is range not reliable?
Range depends only on the extreme values of data, making it sensitive to outliers and less dependable for large datasets.
Q3. How is mean deviation different from standard deviation?
Mean deviation takes absolute differences from the mean, while standard deviation uses squared differences, making it more precise mathematically.
Q4. Can the standard deviation ever be negative?
No, since it is derived from squared deviations, standard deviation is always non-negative.
Q5. Which method is easiest for large datasets in exams like JEE?
The step-deviation method simplifies calculation by reducing data magnitude, making it the fastest for grouped data in JEE problems.
Conclusion
Measures of dispersion are crucial for understanding data variability. Range offers a quick overview, mean deviation provides a moderate understanding, and standard deviation gives the most accurate insight into how data values vary around the mean. For JEE aspirants, mastering these concepts not only helps in solving statistics-based problems but also strengthens analytical and data interpretation skills used in Physics and Chemistry.


Get Social